Materiality |
Materiality of IDEC Group
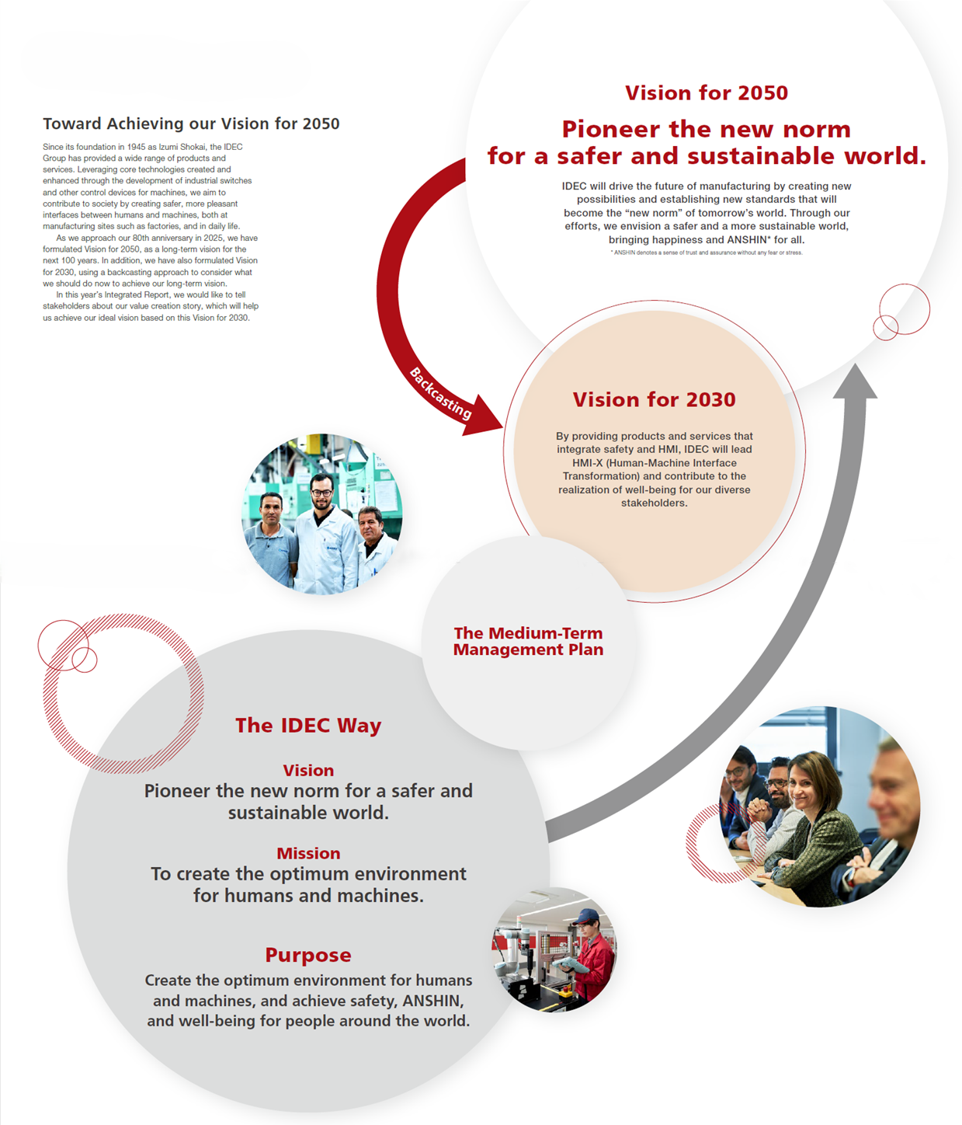
Along with formulating its long-term vision for 2050 and interim vision for 2030 in 2023, IDEC reviewed material issues, incorporating enhancement of its human capital and governance under the heading “business foundation”. IDEC again reviewed some of its material issues in light of the external environment and other factors and, in addition to adding respect for human rights in 2024, also changed its interim vision for 2030.
Sustainability KPIs and Progress
Areas for action have been established in order to achieve our vision for 2030, and sustainability KPIs have been selected for each area.
| Material issues | Vision for 2030 | Sustainability KPIs | FY2025 results (Targets by FY2025) | Targets achieved of FY2025 | FY2026-2028 Targets (based on the new medium-term management plan) | |
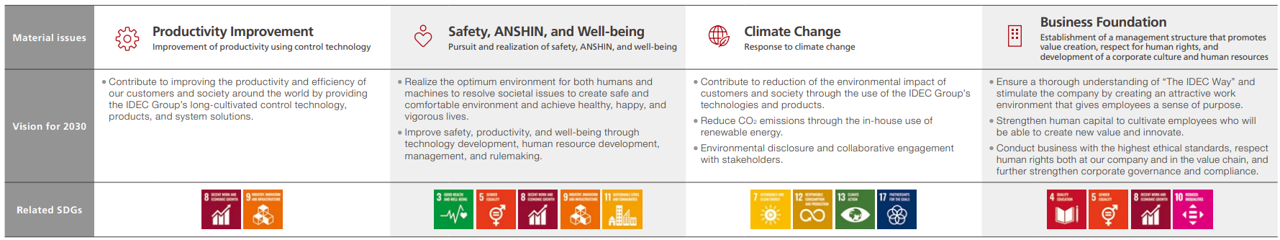
| Productivity improvement | Contribute to improving the productivity and efficiency of our customers and society around the world by providing the IDEC Group’s long-cultivated control technology, products, and system solutions. | Solution ratio to sales | Ongoing | 10% (12%) | 15% | |
| Safety, ANSHIN, and well-being | Realize the optimum environment for both humans and machines to resolve societal issues to create safe and comfortable environment and achieve healthy, happy, and vigorous lives. Improve safety, productivity, and well-being through technology development, human resource development, management, and rulemaking. | CAGR in Safety & Explosion Protection Business (during the past five years) | 5% (15%) | Shift from ratio to sales basis | ||
| Sales of safety-related business | NEW | 11.1 billion yen | — | Increase 50% (vs. FY2025) | ||
| Number of cumulative employees holding safety qualification*1 | Decrease 0.3% YoY (Increase 3.0% YoY) | Focus on a global education system *Without KPI | ||||
| Frequency rate of industrial accidents*2 | Ongoing | 0.68 (0) | 0 | |||
| Climate change | Contribute to the reduction of the environmental impact of customers and society through the use of the IDEC Group’s technologies and products. | Cumulative ratio of enhanced eco-friendly products to total new products (Cumulative total since FY2020) | 66.7% (60% or higher) | ✓ | Shift from ratio to sales basis | |
| Sales of enhanced eco-friendly products | NEW | 2.1 billion yen | — | 8.2 billion yen | ||
Reduce CO2 emissions through the in-house use of renewable energy. Environmental disclosure and collaborative engagement with stakeholders. | Reduction ratio of CO2 emissions (Scope1&2, vs. FY2020) | Ongoing | Decrease 28.4% (Decrease 24%) | ✓ | Decrease 35% | |
| Renewable energy utilization ratio | 15.5% (18%) | ✓ | Shift from our standards to supply chain alignment | |||
| Reduction ratio of industrial wastes (vs. FY2020) | Decrease 28.7% (Decrease 24%) | Shift from our standards to supply chain alignment | ||||
| Ratio of supply chain engagement | NEW | — | — | 80% | ||
| Business foundation | Ensure a thorough understanding of “The IDEC Way” and stimulate the company by creating an attractive work environment that gives employees a sense of purpose. Promoting Diversity, Equity & Inclusion (DE&I) and fostering talent that creates new value | Engagement score | Ongoing | — (Improvement in the scores for 3 main issues (as compared to FY2023)) | — | Set KPI after the global engagement surveys in FY2027 |
| Ratio of males taking childcare leave*2 | Ongoing | 92.3% (90%) | ✓ | 100% | ||
| Ratio of employees with disabilities (Japan) | NEW | 3.1% | — | 3% or higher | ||
| Number of female managers*2 (including associates in the position of leader with subordinates) | 16 (15) | ✓ | Shift from headcount to ratio | |||
| Ratio of female manager | NEW | 9.7% | — | 12% or higher | ||
| Average training costs per person*2 | Ongoing | 58,000 yen (70,000 yen) | 70,000 yen or more | |||
| Conduct business with the highest ethical standards, respect human rights both at our company and in the value chain, and further strengthen corporate governance and compliance. | Human rights and compliance training attendance rate (Japan) | Ongoing | 100% (100%) | ✓ | 100% | |
| Number of serious legal violations | Ongoing | 0 (0) | ✓ | 0 | ||
| Board of Directors’ effectiveness evaluation | Ongoing | 44% of items below industry average (20% or less items below industry average) | 20% or more improvement items | |||
| Sustainability engagement ratio with suppliers*3 | NEW | 98.7% | — | 100% | ||
| Audit and follow-up rate for suppliers with low SAQ scores | NEW | — | — | 100% | ||
*1 Number of employees certified as Safety Assessors, Safety Basic Assessors, Robot Safety Assessors, or Safety Officers
*2 IDEC unconsolidated
*3 Sustainability engagement ratio: SAQ response ratio